
Commodity Share Falls 28 Points as Indices Gain 25
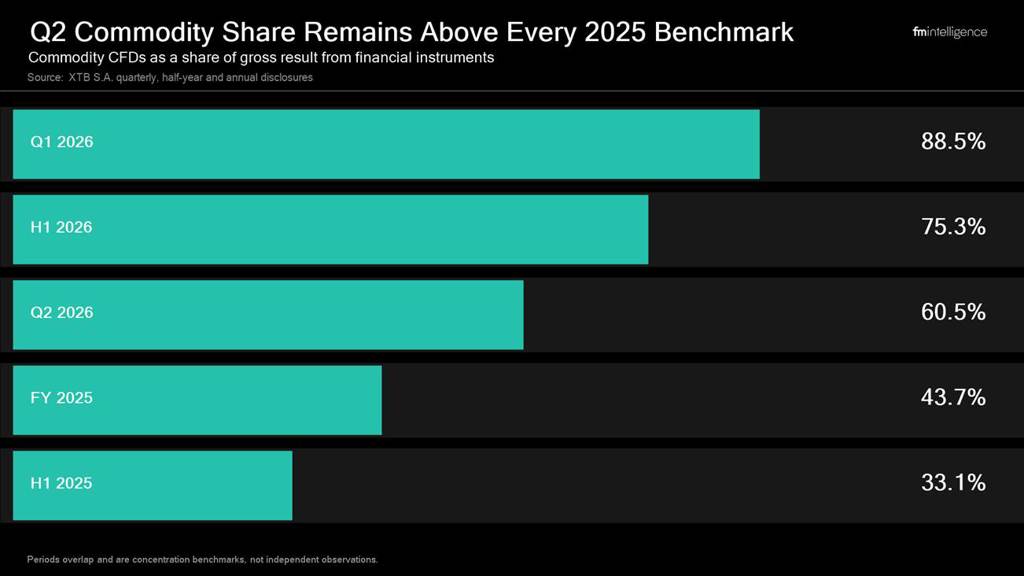
XTB's Q1 result was concentrated in a small group of commodity instruments. Commodity CFDs accounted for 88.5% of the gross result from financial instruments, compared with 29.1% in Q1 2025. Gold generated the largest instrument-level contribution, followed by silver and cocoa. FM Intelligence examined that concentration following the Q1 release.
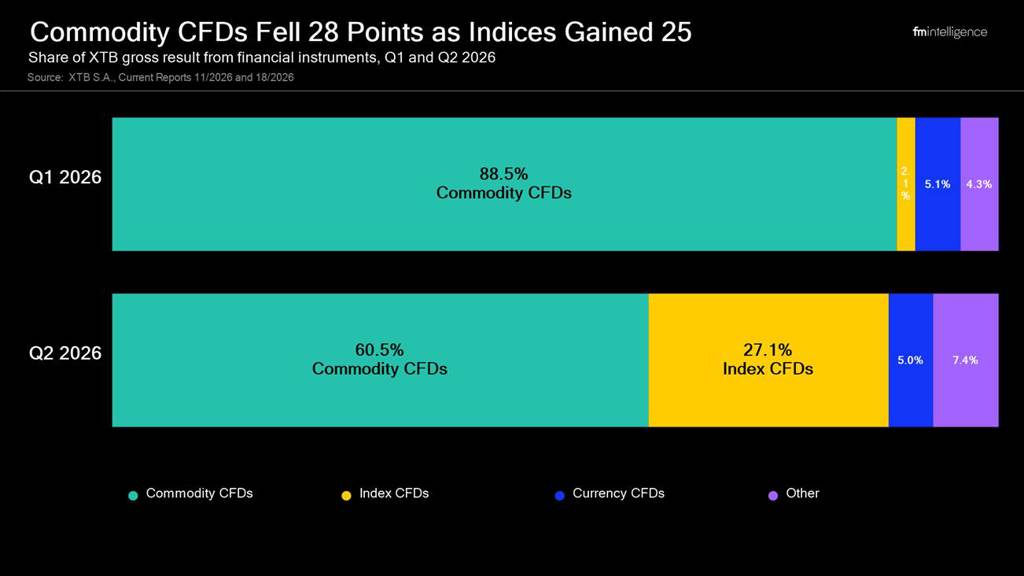
The Q2 composition was broader. Commodities' share decreased by 28.0 percentage points to 60.5%, while index CFDs increased by 25.0 points to 27.1%. Currency CFDs remained almost unchanged at 5.0%, and the share attributed to other instruments increased from 4.3% to 7.4%.
|
Share of gross result from financial instruments |
Q1 2026 |
Q2 2026 |
Change |
|
Commodity CFDs |
88.5% |
60.5% |
-28.0 pp |
|
Index CFDs |
2.1% |
27.1% |
+25.0 pp |
|
Currency CFDs |
5.1% |
5.0% |
-0.1 pp |
|
Other instruments |
4.3% |
7.4% |
+3.1 pp |
Source: XTB S.A., Current Report No. 18/2026, preliminary H1 2026 results. Percentages may not sum exactly because of rounding.
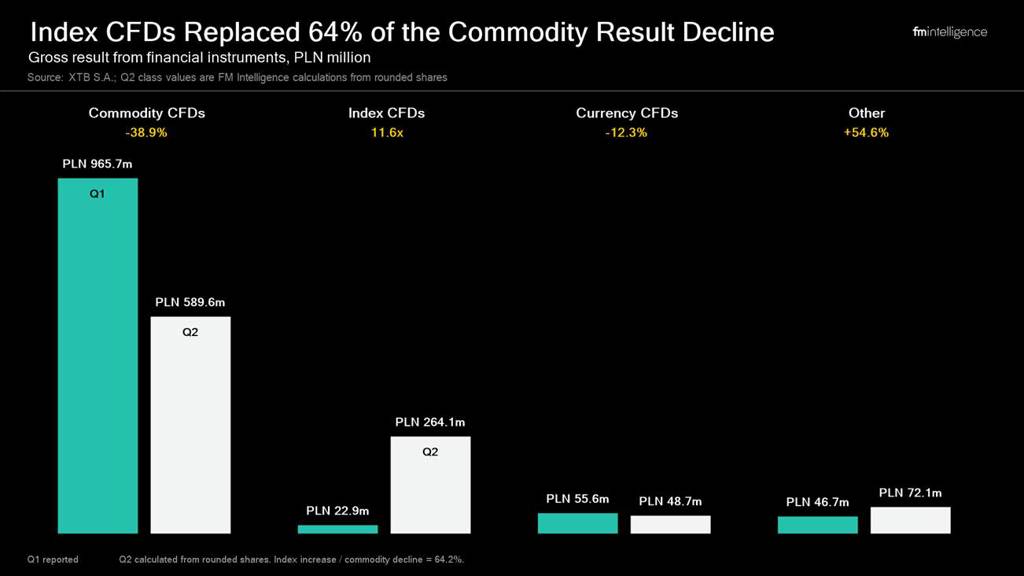
The quarterly percentages imply an approximate commodity result of PLN 589.6 million in Q2, down from the PLN 965.7 million XTB reported for Q1. The implied index-CFD result increased to approximately PLN 264.1 million from PLN 22.9 million.
The PLN 241.3 million increase in the index result therefore replaced approximately 64% of the PLN 376.0 million decline in commodities, according to FM Intelligence calculations. A further PLN 25.5 million increase in other instruments reduced the effect on the aggregate result.
These Q2 amounts are calculated from XTB's reported total and percentage mix, rather than disclosed as separate quarterly amounts. They are approximate because the percentages are rounded to one decimal place.
A 21% Volume Decline Produces an 8% Profit Decline
The change in asset-class composition coincided with lower client trading volume but higher revenue generated per unit of volume.
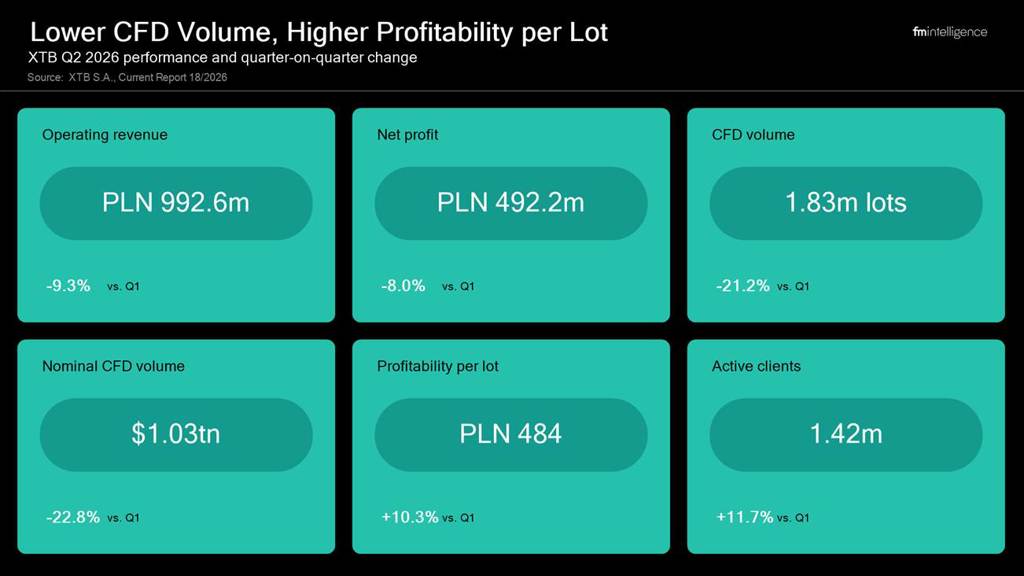
XTB's CFD volume decreased to 1.83 million lots in Q2 from 2.32 million in Q1, a decline of 21.2%. Nominal CFD volume fell 22.8% to $1.03 trillion. By comparison, operating revenue declined 9.3% to PLN 992.6 million and net profit decreased 8.0% to PLN 492.2 million.
Profitability per CFD lot increased to PLN 484 from PLN 439, offsetting part of the volume decline. The broker also reported 1.42 million active clients during Q2, 11.7% more than in Q1.
This combination means that neither the number of active clients nor aggregate trading volume explains the quarterly earnings movement on its own. More clients were active, but they generated fewer CFD lots. XTB earned more from each reported lot as the source of the trading result rotated from commodities toward US index instruments.
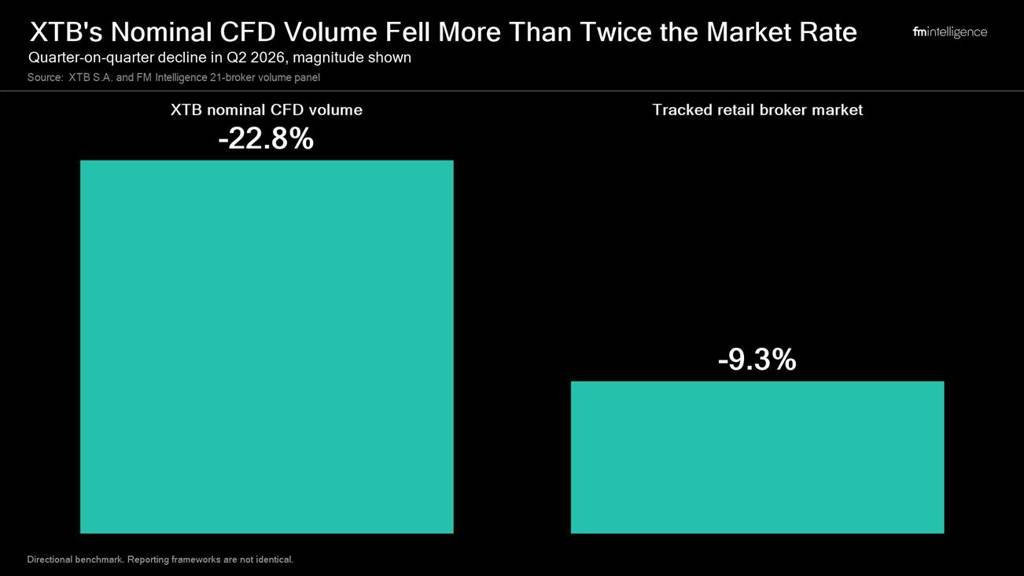
The wider retail CFD market also recorded a sequential slowdown. FM Intelligence calculated that aggregate monthly volume across 21 tracked brokers fell 9.3% in Q2. XTB's 22.8% decline in nominal CFD volume was more than twice that rate. The comparison is directional rather than exact because XTB's company disclosure and the FM Intelligence broker panel do not use an identical reporting framework.
Quarterly profitability has previously moved in the opposite direction. In Q3 2025, higher client activity coincided with profitability per lot falling to PLN 152, reducing XTB's market-making result. FM Intelligence previously examined how volatility and instrument choice affect broker revenue. Q2 2026 provides the reverse configuration: lower volume combined with higher unit profitability.
H1 Commodity Exposure Remains 42 Points Above Last Year
The Q2 rotation reduced concentration relative to Q1, but it did not return XTB's result mix to its earlier composition.
Commodity CFDs generated 75.3% of the H1 2026 gross result from financial instruments, compared with 33.1% in H1 2025. The first-half share was also 31.6 percentage points above the 43.7% reported for full-year 2025.
Index CFDs accounted for 13.9% of the H1 result, down from 46.3% a year earlier. Currency CFDs contributed 5.0%, compared with 15.6% in H1 2025. On an aggregate half-year basis, the move toward indices during Q2 therefore only partially reversed the commodity weighting established in the first three months.
The result mix should also be separated from XTB's customer acquisition and product mix. Shares, exchange-traded funds and Investment Plans accounted for most first transactions by new European Union clients, but CFDs produced PLN 1.98 billion of the PLN 2.07 billion H1 gross result from financial instruments. FM Intelligence analyzed the difference between XTB's investment-led acquisition and CFD-led monetization.
The Q2 figures add a second distinction. XTB remains dependent on CFDs for trading income, but the source of that CFD result can rotate between commodities, indices and currencies within a single quarter.
Lower Commodity Concentration Does Not Remove Earnings Variability
A reduction from 88.5% to 60.5% lowers XTB's dependence on one instrument class. It does not remove the dependence of quarterly earnings on market conditions, client positioning and the outcome of the broker's market-making activity.
In 2025, XTB recorded a 41.3% increase in CFD lot volume while profitability per lot decreased to PLN 215 from PLN 275. Net profit fell 24.8% as operating costs also increased. FM Intelligence reviewed the gap between volume growth and unit profitability in XTB's annual results.
H1 2026 produced the opposite combination. CFD volume decreased 1.8% on XTB's restated comparison, while profitability per lot increased 82.9% to PLN 459. The result was a 79.7% increase in operating revenue and a 150.5% increase in net profit.
The Q1-to-Q2 shift indicates that high profitability can persist while the contributing asset class changes. It does not establish that the Q2 mix will continue. XTB states that changes in the gross-result structure are driven by client investment decisions and conditions in financial and commodity markets. The company does not publish a forecast for profitability per lot or the future instrument mix.
For investors and competing brokers, the relevant exposure is therefore broader than commodity prices alone. It includes the interaction among volatility, client direction, trading volume and XTB's result on individual instrument groups. Q2 reduced single-class concentration, while leaving the earnings model dependent on conditions that can change between reporting periods.
Methodology: This analysis uses XTB S.A.'s preliminary H1 2026 disclosure, Current Report No. 18/2026, released on July 30, 2026, and its Q1 2026 and FY 2025 disclosures. Quarterly PLN results by instrument class for Q2 are FM Intelligence calculations based on XTB's PLN 974.6 million gross result and its reported percentage composition. Values are approximate because category shares are rounded. CFD lot and profitability comparisons use XTB's restated comparative series following the alignment of cryptocurrency-CFD lot definitions with currency CFDs. The analysis does not forecast future instrument mix, market volatility or profitability per lot.