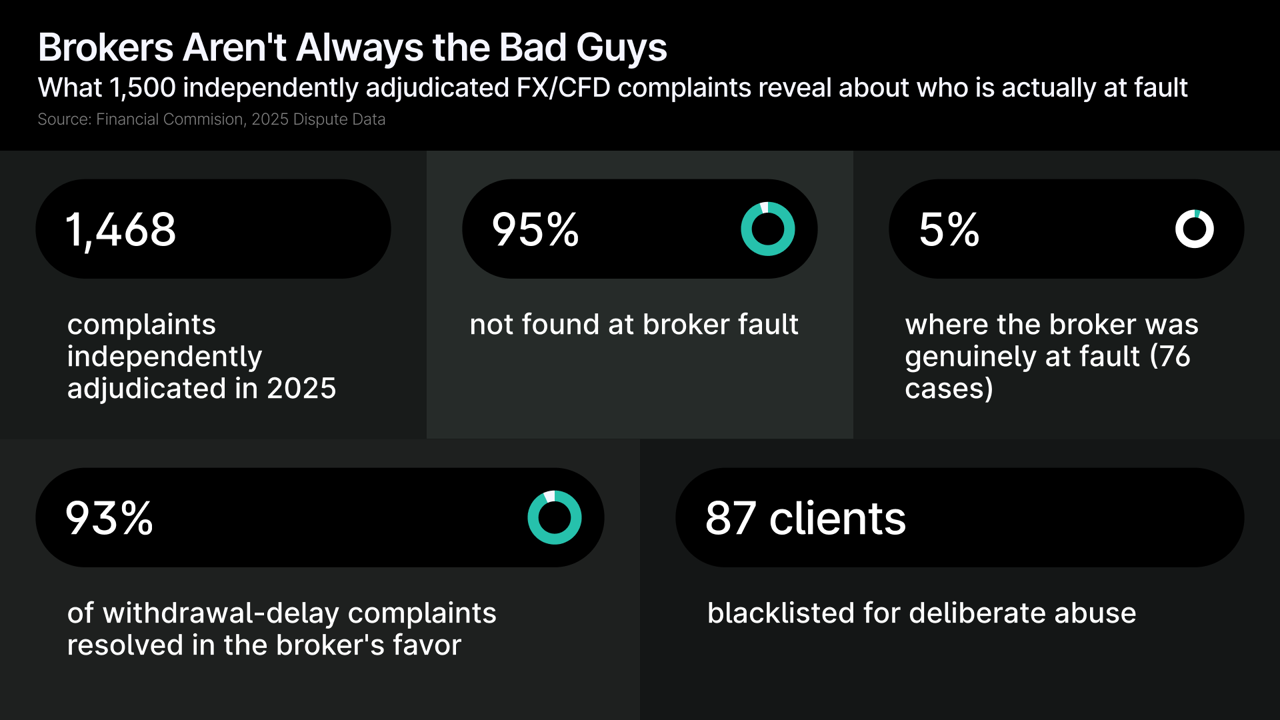
FM Intelligence analyzed every dispute the Financial Commission adjudicated in 2025: 1,468 complaints between retail traders and member brokers, reviewed by an independent panel of 18 industry experts. In 94.8% of cases, the panel did not find the broker at fault. Money Withdrawal Delays were the single largest complaint type at 558 cases, or 38.0% of the total, yet 92.8% of them were resolved in the broker’s favor.
Across all filings, traders sought a combined $21.4 million and the Commission awarded $496,304. The data also documents abuse running the other way: 87 clients were blacklisted in 2025 for deliberate misconduct. And in 76 cases, 5.2% of the total, the broker was found genuinely at fault.
How 1,468 Disputes Were Resolved
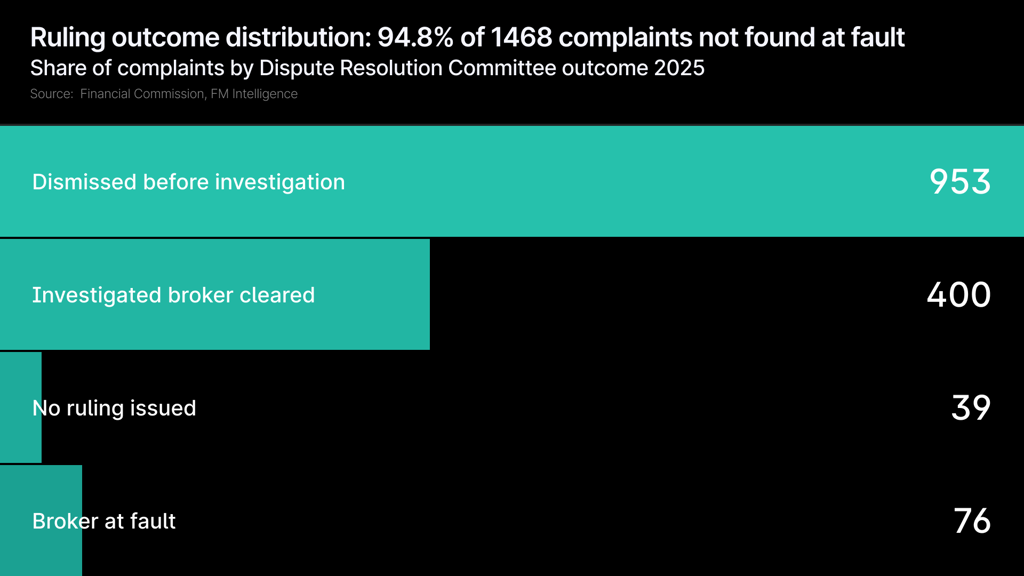
Of the 1,468 complaints the Financial Commission processed in 2025, 94.8% did not end in a finding against the broker. The outcomes fall into four groups. 64.9% (953 complaints) were dismissed before formal investigation for lack of sufficient merit. Another 27.2% (400 cases) were investigated by the Dispute Resolution Committee, which then cleared the broker. In 2.7% (39 cases) no ruling was issued. That leaves 5.2%, or 76 complaints, where the Committee found the broker at fault.
The financial side points the same way. Across all filings, complainants sought a combined $21.4 million, and the Committee awarded $496,304. The average claim was $14,596, but the median was $397.50, meaning more than half of all complaints disputed amounts under $400. When the Committee did award compensation, the average payout was $4,963.
.png?width=1024)
One caveat applies to the dollar comparison. The $21.4 million claimed spans complaints filed against both Financial Commission member and non-member brokers, while awards and enforcement apply only to member cases.
Any headline ratio between the total claimed and the total awarded therefore overstates the gap for the enforceable population, and is best read as illustrative. A dismissal also records that a complaint lacked sufficient merit to proceed, not that the underlying frustration was invented. The sections that follow look at both sides of that line.
What Traders Complain About
Financial complaints, most of them withdrawal-related, made up 48.9% of all cases (718). Trading-related disputes followed at 32.4% (476), and non-trading complaints at 18.7% (274).
.png?width=1024)
Within those groups, Money Withdrawal Delays were the largest single type at 558 complaints, 38.0% of the dataset. Account blocks followed at 218 (14.9%), price checks at 137 (9.3%), agreement breaches at 127 (8.7%), platform issues at 112 (7.6%), and stop-outs at 64 (4.4%).
Withdrawal delays are also the complaint most visible on social media and aggregator sites, which gives their outcome added weight: 92.8% of withdrawal-delay complaints were resolved in the broker’s favor, with only 7.2%, 40 of 558, found at fault. Most withdrawal delays trace to KYC and AML compliance checks, bank processing times, or bonus-condition lock-ins rather than broker misconduct.
Other sub-categories follow a similar pattern. Price-check complaints had a 3.6% broker-fault rate and stop-out complaints 4.7%. Slippage complaints had a 0.0% fault rate, with none of 22 cases found against the broker. The panel of 18 experts attributed these outcomes to standard market behavior rather than manipulation. By category, financial complaints carried the highest fault rate at 6.3%, ahead of trading-related at 4.2% and non-trading at 4.0%.
The amounts in dispute were mostly small. 36.6% of complaints (537) involved less than $100, and another 25.1% (368) fell between $100 and $1,000, so 61.7% of all complaints were under $1,000. At the other end, just 2.5% (36 complaints) exceeded $100,000, but those 36 cases accounted for $13.5 million of the $21.4 million claimed.
.png?width=1024)
Why
Volume Peaked in December
Q4 2025 produced 37.0% of all complaints (543 of 1,468), more than any other quarter.
From a baseline of 81 to 110 complaints a month in the first half of the year, volume rose from late summer onward: 154 complaints in September, up 56% from August’s 99, then 161 in October, 181 in November, and 201 in December, the highest of the year.
.png?width=1024)
The market backdrop helps explain the pattern. Gold set successive record highs in Q4 2025, supported by central-bank buying, safe-haven demand, and rate-cut repricing around FOMC meetings and US CPI releases, conditions that tend to produce stop-out, slippage, and price-check disputes. The USD/JPY carry-trade unwind of July and August 2025, which moved the pair from above 161 to below 142 within weeks, triggered stop-outs across retail positions that carried into Q3 and Q4 volumes. December’s thin holiday liquidity and year-end rebalancing added to the moves.
December’s average complaint value reached $23,446, more than 60% above the annual average of $14,596, as traders carried larger positions into a thinner market.
Broker-fault rates moved the other way. They were 6.2% in October, 3.9% in November, and 0.5% in December, a single case out of 201. As volume climbed to its annual peak, the fault rate fell to its annual low. The Financial Commission’s Q1 2026 report noted the pattern continued into the new year, attributing a 37% quarter-over-quarter rise in new complaints to “market volatility and safe-haven demand,” with gold and oil identified as primary drivers. On this evidence, volume tracks volatility rather than misconduct.
Case study – XAUUSD news event.
A client was accused of price-latency arbitrage after placing multiple Buy Stop and Sell Limit orders ahead of a US CPI release in XAUUSD, with the broker alleging the client had exploited a price-feed lag for risk-free profit. Comparing execution prices during the incident against general market prices, the Committee found no deviation in the broker’s XAUUSD execution and identified no latency arbitrage. The client was cleared and awarded the full profit. The dispute was market-driven rather than misconduct on either side, and a reminder that brokers can also misread normal trading activity during volatile events.
When the Client Is at Fault
87 clients, 5.9% of all complainants, were blacklisted by the Financial Commission in 2025 for documented, deliberate abuse.
Negative Balance Protection (NBP) exploitation accounted for the largest share: roughly 50 cases, 57.5% of blacklisted clients, involving traders who over-leveraged ahead of scheduled news events, taking outsized positions to collect profits if the trade moved their way and invoking NBP if it did not.
This reflects an exploit of a regulatory design choice rather than a flaw in trader psychology. ESMA mandated Negative Balance Protection so retail clients cannot lose more than their deposit, a consumer-protection measure with a clear purpose. It also created an asymmetry: the client’s downside is capped at the deposit, while a broker running a B-book position faces theoretically unlimited downside during a gap event. The roughly 50 NBP cases indicate that a subset of traders exploit that asymmetry deliberately.
Bonus abuse accounted for about 13 cases (14.9%), where traders opened multiple accounts to collect bonus credits and withdraw them. Latency arbitrage, exploiting price-feed lag between liquidity providers, accounted for about 8 cases (9.2%), and fraud or KYC fraud for about 4 cases (4.6%). One broker in the anonymized dataset (Broker 2) accounted for 26 blacklisted clients on its own, a pattern consistent with organized abuse targeting specific brokers’ NBP or bonus policies.
Of the 87 blacklisted clients’ complaints, 80.5% had been ruled in the broker’s favor. Their complaints totaled $895,919, an average of $10,298 per case, well above the dataset’s overall average. These were a documented subset engaged in deliberate exploitation rather than retail traders meeting a stop-out for the first time.
Case study – EA commission-avoidance scheme.
A client deployed an Expert Advisor to run more than 900,000 trades in crypto CFDs across multiple accounts, exploiting a platform setting to avoid commission charges, for about $2,500 in trading profits. The broker closed the accounts for a terms-and-conditions violation but returned the client’s initial deposit and profits, totaling $1,016. The Committee found the resolution sufficient and issued no formal ruling. The case was systematic, automated exploitation at scale rather than a trading error.
Most traders who file complaints are legitimate, and their frustration is real even when a complaint lacks merit. The 87 blacklisted cases, quantified and documented through independent adjudication, show that accountability runs in both directions.
Where Brokers Do Fail
In 76 complaints, 5.2% of the dataset, the Committee found genuine broker fault. Those cases produced $414,189 in awards, an average of $5,450 each, and they are what make the 94.8% figure credible rather than one-sided.
The failures cluster where the volume is. Money Withdrawal Delays, the largest category, had a 7.2% fault rate: 40 cases where brokers delayed or blocked legitimate withdrawals, distinct from routine KYC, AML, or bank-transfer friction. Agreement breaches followed at 7.1% (9 cases), where brokers acted against their own stated terms. Platform issues accounted for 5.4% (6 cases), stop-outs 4.7% (3 cases), and account blocks 4.6% (10 cases).
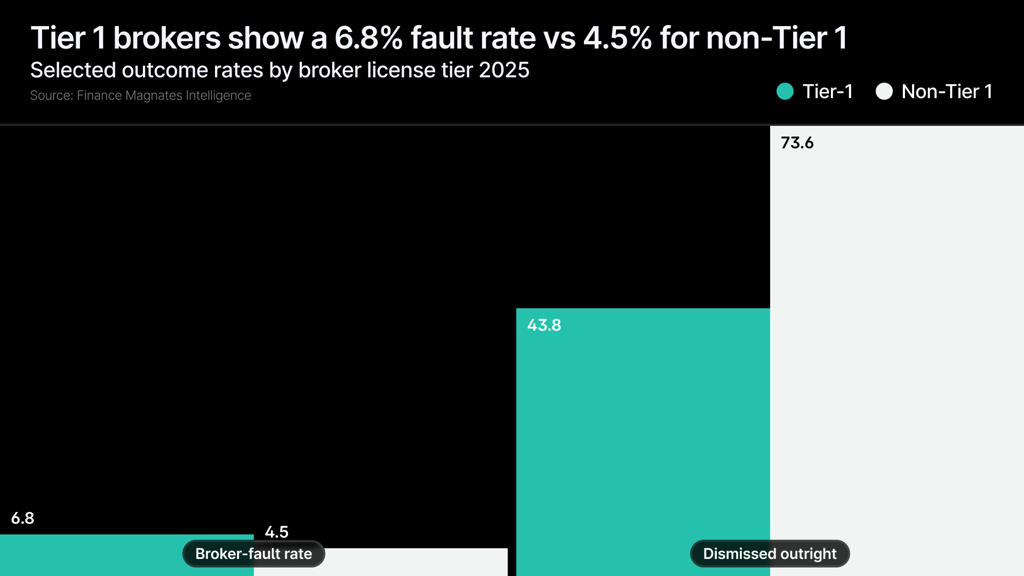
Broker license tier cuts against the intuition that stricter regulation means cleaner conduct. Brokers holding Tier 1 licenses (FCA, CySEC, ASIC) had a higher fault rate, 6.8%, against 4.5% for non-Tier 1 brokers. Tier 1 firms accounted for 29.1% of complaints but 50.6% of total awards ($251,173 of $496,304).
A higher fault rate does not mean Tier 1 brokers behave worse. They tend to serve more experienced clients who file more substantive complaints: only 43.8% of Tier 1 complaints were dismissed outright, against 73.6% for non-Tier 1. They also offer more complex products, variable execution, and advanced order types that generate more genuine execution disputes, and conduct rules under MiFID II and the FCA create explicit benchmarks clients can measure a broker against. The higher fault rate reflects the character of the disputes more than the quality of the conduct.
Case study – Withdrawal technical issue.
A client hit a genuine technical failure in a broker’s withdrawal system that blocked processing, and the broker’s support team was unresponsive during the Internal Dispute Resolution phase. During External Dispute Resolution, the broker identified the fault, corrected the system, and processed the withdrawal, resolving the case before experts were summoned. A real failure was found and fixed, but the fault was the broker’s.
Case study – Synthetic USD/JPY weekend position.
A client was accused of abusive trading for building a synthetic USD/JPY position through BTC/USD and BTC/JPY pairs over a weekend, when the OTC USD/JPY market was closed, using different liquidity pools for each pair. The Committee found the client had not exploited any platform vulnerability and had simply used available products, but also that the broker’s risk team should have flagged and hedged the JPY exposure. The experts split 50/50, and the client received half of the profits from the trades. The broker was not acting in bad faith, but its risk management fell short.
These 76 cases, and the $414,189 awarded in them, are what give the external dispute-resolution process its credibility. A mechanism that only ever cleared brokers would carry no weight; the willingness to find fault, award compensation, and publish the outcomes is what makes the 94.8% not-at-fault rate meaningful.
The Geography of Complaints
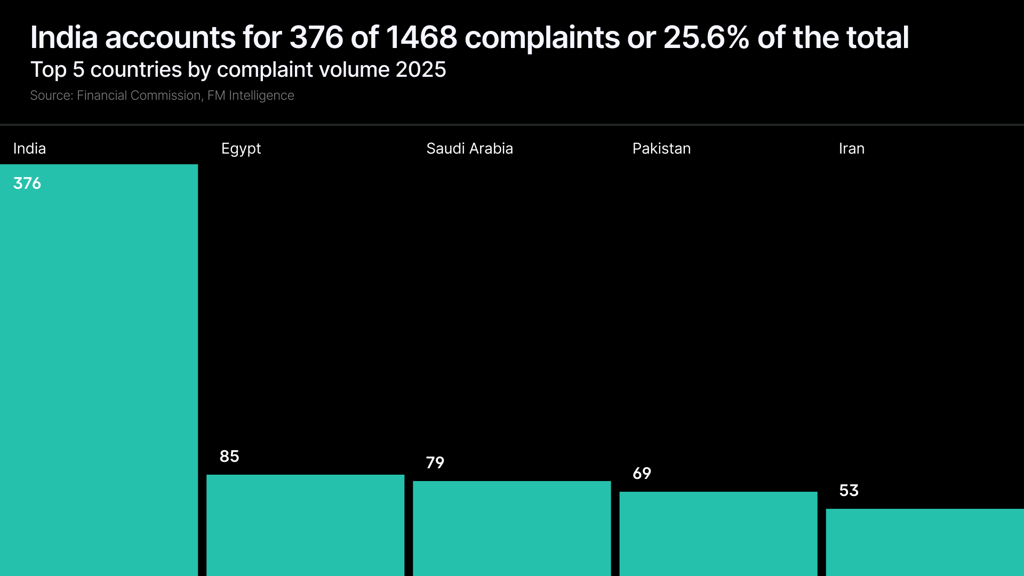
India generated 376 complaints, 25.6% of the total and more than the next four countries combined. Egypt followed at 85 (5.8%), Saudi Arabia at 79 (5.4%), Pakistan at 69 (4.7%), and Iran at 53 (3.6%). The top five countries accounted for 45.1% of all complaints.
By region, South Asia produced 32.2% of complaints and MENA 22.8%, a combined 55.0% of the dataset. Europe contributed 12.2%, Southeast Asia 9.5%, and Latin America 6.0%.
The distribution tracks where retail FX participation is growing, not where conduct is worse. India’s 376 complaints reflect the scale of retail trading across the subcontinent, with new traders reaching offshore brokers through mobile platforms and digital payment channels. Egypt’s 85 map to demand for USD-denominated returns against 30%-plus inflation and EGP devaluation, while Gulf volumes align with expanding fintech activity and regulatory modernization under CMA and DFSA frameworks. Complaint volume scales with trader population.
70.9% of all complaints (1,041) involved non-Tier 1 brokers, in jurisdictions where statutory regulators often provide no ombudsman service, public complaints database, or compensation scheme. For traders in those markets, independent dispute resolution is frequently the only realistic route to redress. The language split follows the same map: 77.6% of complaints were filed in English, then Arabic (7.6%), Russian (2.6%), and Spanish (2.5%).
How Quickly Disputes Close
The Financial Commission resolved complaints in a mean of 7.5 days and a median of 3 days, with 51.9% closed within three days.
.png?width=1024)
Speed varied by complaint type. Financial complaints, made up mostly of withdrawal cases with relatively straightforward documentation, resolved in a mean of 5.2 days and a median of 1 day. Non-trading complaints took a mean of 7.2 days and a median of 4. Trading-related complaints, which require analysis of execution logs and price data, took longest, at a mean of 11.4 days and a median of 10.
One measurement note belongs here. The fastest closures, including same-day resolutions, include complaints filed against non-member firms, which are frequently closed administratively without full adjudication. The resolution profile for member-broker cases alone is therefore slower than the all-filings figures suggest.
Speed matters most for small claims. With 61.7% of 2025 complaints under $1,000, a median resolution measured in days is the difference between having an accessible route to redress and having none. Statutory ombudsman schemes such as the UK Financial Ombudsman Service, the Australian Financial Complaints Authority, and the CySEC Financial Ombudsman operate on longer timelines suited to a broader and more complex mandate; fast external dispute resolution addresses a specific gap for smaller-value, often cross-border retail disputes that can fall outside those schemes.
The process held up under load. In Q1 2026, new filings rose 37% quarter-over-quarter on continued gold and oil volatility, and the Commission resolved 22% more cases without a change in resolution times or outcomes.
Reading the Numbers Correctly
Complaint counts on their own say little about conduct. The four brokers that drew the most complaints accounted for 49.0% of all filings in 2025, yet their fault rates ran from 2.7% to 7.1%, clustered around the 5.2% dataset average. The broker with the most complaints, Broker 14, also carried one of the lowest fault rates.
|
Broker |
Complaints |
Share of total |
Broker-fault rate |
|
Broker 14 |
291 |
19.8% |
2.7% |
|
Broker 9 |
194 |
13.2% |
6.2% |
|
Broker 1 |
127 |
8.7% |
7.1% |
|
Broker 3 |
107 |
7.3% |
5.6% |
|
Top four combined |
719 |
49.0% |
2.7% to 7.1% |
|
Dataset average |
1,468 |
100% |
5.2% |
Volume mainly reflects the size of a broker’s client base, its geographic mix, and market conditions. A broker handling 500,000 accounts will generate more complaints than one handling 5,000, much as a large hospital records more patient complaints than a small clinic. Volume is a proxy for size, not for conduct.
That distinction has practical uses:
- Compliance and risk teams can report independently adjudicated outcomes instead of raw complaint counts. A 2.7% fault rate across 291 reviewed complaints carries more information than zero complaints at a firm too small or too opaque to generate them.
- Business development and IB due diligence can read a dispute-resolution record as a measurable signal. Voluntary submission to binding independent adjudication, where the decision binds the broker but not the client, indicates confidence rather than marketing.
- The industry needs accountability on both sides. The 76 broker-fault cases and $414,189 in awards show traders need a fast, independent route to redress, while the 87 blacklisted clients show brokers need a way to identify and document abuse.
The not-at-fault cases carry a cost as well. Across the 1,392 complaints that did not find against a broker, FM Intelligence estimates the cost of handling them at $1.1 million to $4.2 million, based on industry benchmarks of $800 to $3,000 per complaint in staff time, legal review, and documentation. That estimate is directional, and the per-complaint range is a benchmark rather than a figure drawn from the dataset.
The data does not show that brokers are good. It shows that 94.8% of independently adjudicated complaints did not find them at fault, that 5.2% did, and that the Commission awarded $496,304 where the evidence supported it. It is the first industry-wide, independently adjudicated baseline for a debate that has run mostly on narrative.
Methodology and Data Note
Data source: Financial Commission 2025 anonymized complaint dataset, covering all disputes processed across 50-plus member brokers during the calendar year.
Sample: 1,468 complaints.
Adjudication panel: an independent panel of 18 industry experts on the Dispute Resolution Committee.
Anonymization: all broker names are redacted. No identifiable client data, names, account numbers, IP addresses, or sub-national geography, appears in any deliverable; geographic data is reported at country level only. Case studies are drawn from Financial Commission-approved anonymized summaries.
Member and non-member scope: claimed-value and resolution-speed figures include complaints filed against both member and non-member firms. Awards and enforcement apply only to member-broker cases, and same-day closures include non-member complaints closed administratively. Member-only figures would show a smaller claimed total relative to awards and slower headline resolution times.
Self-selection caveat: the dataset covers 50-plus Financial Commission member brokers that voluntarily submit to independent adjudication. The 94.8% not-at-fault rate reflects that self-selected population, not the entire FX/CFD industry.
Limitations: Tier 1 classification is broker-stated, not independently verified against regulator registers. Per-complaint cost estimates ($800 to $3,000) are industry benchmarks used for directional context only. The Financial Commission does not process cryptocurrency or digital-asset complaints, which are excluded from the dataset.
Disclosure: this whitepaper was co-produced with data provided by the Financial Commission, an independent external dispute-resolution body for the online trading industry. The Financial Commission reviewed the analysis for data accuracy. Editorial framing and all conclusions are the responsibility of FM Intelligence.