Where the €12.8 Million Went
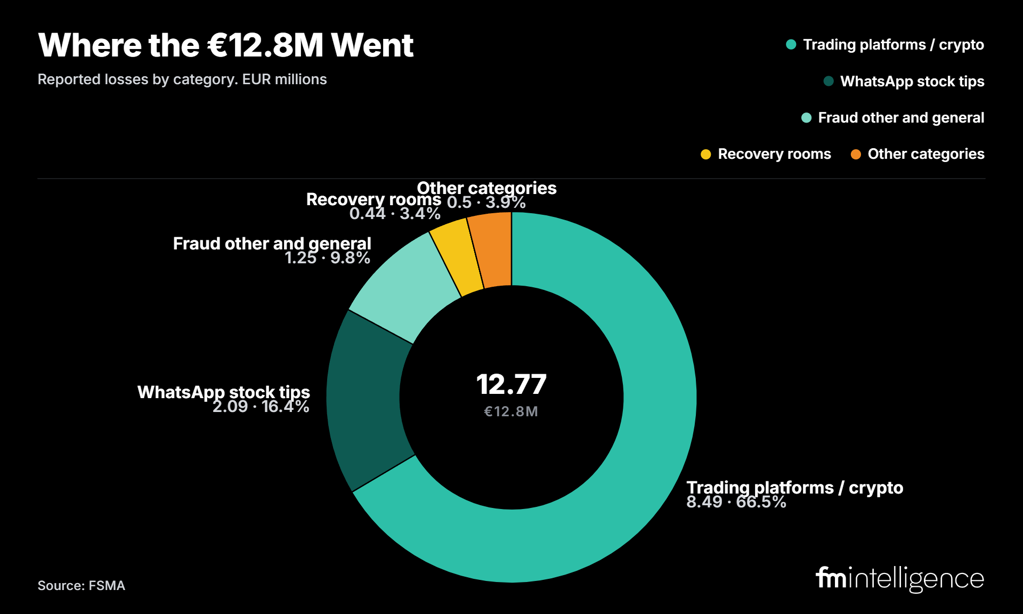
The single largest loss category was fraudulent trading platforms and cryptocurrency, at €8.49 million ($9.8 million), or 66.5% of the half-year total. WhatsApp stock-tip fraud was second at €2.09 million. Together the two categories held 82.8% of reported losses; the remaining six accounted for 17.2%.
|
Loss category (H1 2026) |
Loss (€) |
Share |
|
Fraudulent trading platforms / crypto |
8,486,219 |
66.5% |
|
Stock-tip fraud via WhatsApp |
2,085,458 |
16.3% |
|
Fraud (other and general) |
1,248,525 |
9.8% |
|
Recovery rooms |
438,740 |
3.4% |
|
Other unregulated activities |
261,468 |
2.0% |
|
Fraudulent portfolio management |
150,950 |
1.2% |
|
Fake credit offers |
69,022 |
0.5% |
|
Boiler rooms |
20,600 |
0.2% |
|
Total |
12,760,982 |
100% |
Source: FSMA, Investment fraud and unlawful offers Dashboard, 1st half of 2026. Values as reported by consumers within the FSMA supervisory remit.
The WhatsApp Wave, Quantified
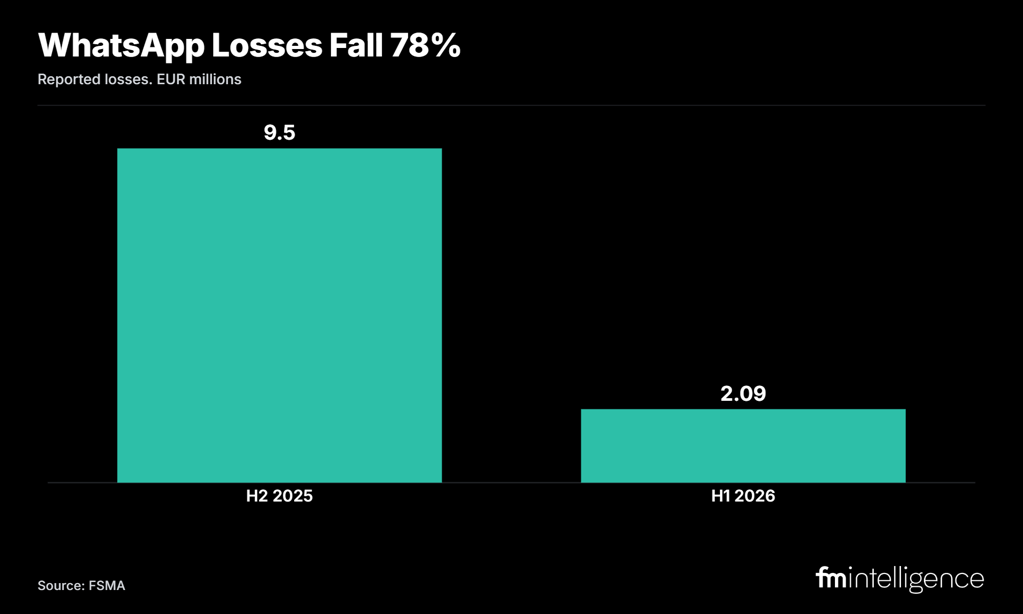
The typology that drew the coverage is receding on every axis the FSMA discloses. Reports fell 71% and losses fell 78% between the second half of 2025 and the first half of 2026.
- Reports: 263 (H2 2025) to 76 (H1 2026), down 71.1%.
- Losses: €9.5 million to €2.09 million, down 78.0%.
- Loss per report: €36,122 to €27,440, down 24.0% on a like-for-like basis. The FSMA separately cited an average of €73,000 per actual victim in H2 2025.
The FSMA dates the turn to February 2026 and attributes it to public-awareness campaigns run across Europe. Finance Magnates covered the consumer-facing story in “WhatsApp Stock-Tip Fraud Losses Fall to €2 Million in Belgium as Wave Recedes.”
Severity Runs Opposite to Frequency
The clearest structure in the dataset is the split between how often a fraud is reported and how much each report costs. WhatsApp fraud was 6.0% of reports but 16.3% of losses, an over-representation of 2.75 times. Fake credit sits at the opposite pole: high report volume, an average loss near €3,000, and €69,022 in total.
|
Category |
Reports |
Loss (€) |
€ / report |
Loss share ÷ report share |
|
Trading platforms / crypto |
661 |
8,486,219 |
12,838 |
1.28x |
|
Stock-tip via WhatsApp |
76 |
2,085,458 |
27,440 |
2.75x |
Source: FSMA
Read together, the categories sort into three shapes worth tracking:
- Volume and value: trading platforms and crypto lead both counts and euros, the structural base of the problem.
- High-ticket, low-volume: WhatsApp and recovery rooms, where each case is large but cases are few.
- High-volume, low-value: fake credit, where reports are frequent and individual losses are small.
Note: report counts are disclosed by the FSMA for the two named categories above; the per-category loss figures in the first table are exact, while report-level breakdowns for the smaller categories are not published in comparable form.
A Growth Curve That Is Flattening
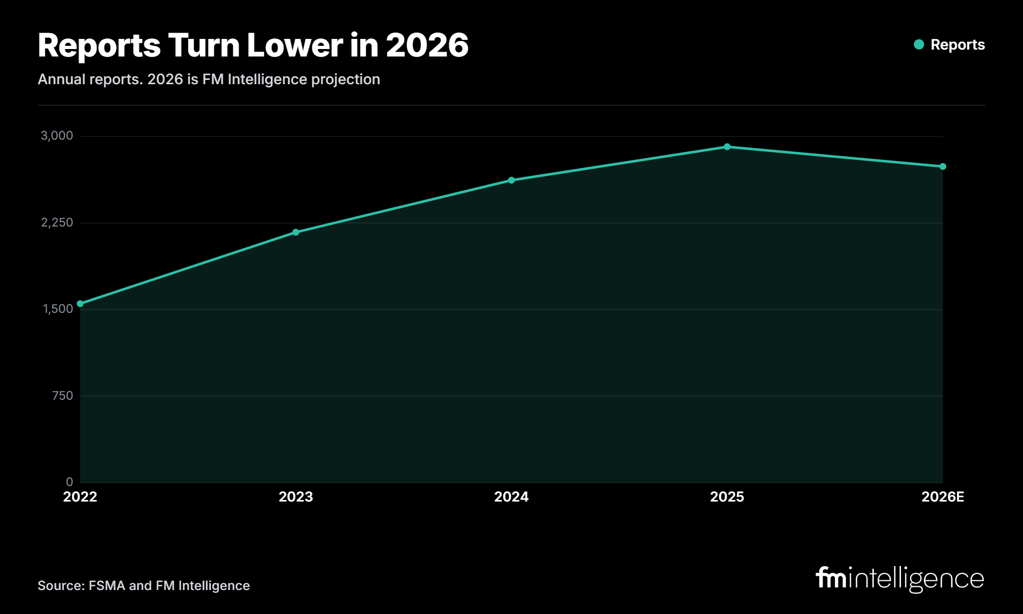
Year-over-year growth in total reports has decelerated for three straight years, and the first half of 2026 came in below the same period of 2025. The monthly average for 2026 stands at 213, against a 2025 average of 243.
|
Year |
Total reports |
YoY change |
|
2022 |
1,551 |
n/a (base year) |
|
2023 |
2,170 |
+39.9% |
|
2024 |
2,621 |
+20.8% |
|
2025 |
2,911 |
+11.1% |
|
2026 (H1) |
1,277 |
-0.9% vs H1 2025 |
Source: FSMA
Within 2026, the monthly run-rate stepped down after the first quarter: Q1 averaged 233 reports, Q2 averaged 193. That mirrors the post-February decline the FSMA flags for WhatsApp fraud specifically, now visible in the aggregate.
October Is the Tell
.png?width=1024)
The one recurring pattern across the full 2022-2025 series is an autumn peak. October was the single highest month of the year in both 2023 (311) and 2025 (358), and the second half has out-run the first in three of the last four years.
|
Year |
H1 reports |
H2 reports |
H2 / H1 |
|
2022 |
766 |
785 |
1.03 |
|
2023 |
925 |
1,245 |
1.35 |
|
2024 |
1,342 |
1,279 |
0.95 |
|
2025 |
1,289 |
1,622 |
1.26 |
|
Mean |
|
|
1.15 |
Source: FSMA
This is the caveat on the “wave receded” read: the H1 slowdown lands right before the months that have historically carried the year. A second-half uptick would be seasonal, not a reversal of the WhatsApp decline.
FM Intelligence 2026 Projection
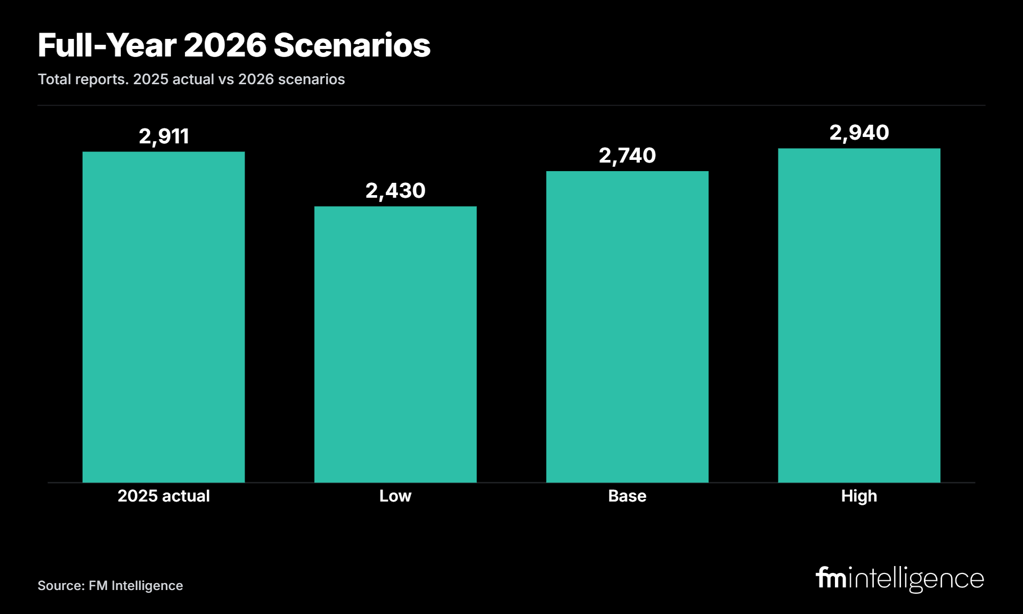
FM Intelligence models full-year 2026 report volume from the H1 actual of 1,277 and the 2022-2025 seasonal profile. Because only six months of 2026 are available, these are run-rate scenarios with stated assumptions, not a compounded extrapolation.
|
Scenario |
Full-year reports |
vs 2025 |
Driver |
|
Base |
2,740 |
-5.9% |
H2 tracks the 1.15 mean H2/H1 ratio |
|
Low (faster decline) |
2,430 |
-16.4% |
Q2 run-rate of 193/mo persists into H2 |
|
High (autumn resurgence) |
2,940 |
+0.9% |
H2/H1 returns to the 1.30 seen in 2023/2025 |
Source: FM Intel
On a probability weighting of 50% base, 30% low, and 20% high, the expected full-year total is about 2,690 reports, a 7.7% decline from 2025 and the first annual fall since 2022. On losses, the H1 figure of €12.76 million annualizes toward €24 million to €28 million on the report trend; FM Intelligence weights the lower end, because the fading of high-severity WhatsApp cases pulls the average case value down.
How It Compares
Belgium's mix rhymes with data FM Intelligence analyzed for Australia in June 2026. There, Scamwatch reported A$162.6 million in investment-scam losses for FY2025, with online contact the dominant channel and platform-based schemes the largest loss category. The absolute euros differ by market size, but the composition is the same: a trading-platform and crypto core, a rotating secondary typology, and losses concentrated in a minority of high-value cases.
The concentration also maps onto Finance Magnates' regulatory beat. More than 62% of the 157 entities the FSMA warned against in H1 2026 were illicit trading platforms; the FSMA issued 9 warnings covering 185 websites. That is the same offshore, unlicensed-broker archetype that CySEC, ASIC and ESMA enforcement target, seen from the consumer-loss side.
Methodology. Monthly report counts, category losses and warning figures are from the FSMA half-year dashboard; annual totals were re-derived from the monthly series and match the FSMA's printed totals exactly. Loss shares, per-report values, the loss-to-report severity index, H2/H1 ratios and year-over-year changes are FM Intelligence calculations on FSMA data. Full-year 2026 projections are run-rate scenarios built on the H1 actual and the 2022-2025 seasonal profile, weighted 50/30/20. Euro-to-dollar conversions use €1 = $1.15. WhatsApp H2 2025 figures are drawn from an earlier FSMA release.
Sources
1. FSMA, Investment fraud and unlawful offers Dashboard, 1st half of 2026, July 2026.
2. FSMA, Warnings register, FSMA.be.
3. Finance Magnates, “WhatsApp Stock-Tip Fraud Losses Fall to €2 Million in Belgium as Wave Recedes,” 16 July 2026.
4. FM Intelligence, Australia investment-scam analysis (Scamwatch FY2025), June 2026.